
This fall, cities across the US have introduced legislation to reform various aspects of their police forces. Many of the policies under discussion came about in the Nixon era at the start of the “War on Drugs,” and have since moved to the fore of discussions about how to reform police behavior in the wake of protests against brutality. Recent studies by YouGov in cities across the country suggest voters are ready to change some of these policies.
We fielded studies of registered voters in cities including Baltimore, Birmingham, Charlotte, Detroit, Memphis, and St. Louis, as well as several national surveys. We asked voters about many policies (see the CrunchBox at the end of this article), with a focus on civil asset forfeiture and ending no-knock raids.
While voters are more supportive of moderate reforms than radical ones, they are ready to move away from the status quo. We asked voters to choose which they would prefer among:
- Status quo: Police should be able to keep or sell seized assets even if there is never a related conviction
- Only in relation to a crime or arrest: Police should only be able to keep or sell seized assets if a court agrees those assets are related to a crime or arrest
- Temporary only: Police should never be able to keep or sell seized assets, and should return them once an investigation is closed
- Never: Police should not be able to seize assets, only document them as needed for an investigation
In cities across the United States, only a handful of voters support the status quo on civil asset forfeiture — below ten percent in all of the cities we surveyed. Between 41% and 49% of voters in the cities we surveyed said they preferred only allowing civil asset forfeiture of assets directly related to an arrest or crime - the most commonly chosen option in all cases.
A further 23-31% of voters said that, no matter what, civil asset forfeiture should only be temporary. Between 10% and 18% of voters — in every case, more than those who support the status quo — say civil asset forfeiture shouldn’t be allowed at all.
Though there is no current federal legislation on this issue, we included the same item in a recent national study. As US cities typically have more Democratic voters, a national sample allowed us to correct for factors like partisanship.
Nationwide, voters agree with those in our city study. Fully 53% believe that civil asset forfeiture should only be allowed in direct relation to a crime or arrest, and 17% said that civil asset forfeiture should only be temporary. Another 17% said that civil asset forfeiture should not be allowed at all - far more than the 3% who support the status quo.
In several of the cities in our study that are considering such legislation, we also asked voters about creating publicly accessible databases on police use of force. While not directly changing the behavior of police departments, these policies would give the public access to data about police conduct in their cities — and, according to some proposals, nationally.
Voters support making this sort of data available. From a high of 75% of Baltimore voters, down to a ‘low’ of 53% of voters in Memphis, Tennessee, most somewhat or strongly support creating such a policy.
In the same study, we included an item on banning so-called ‘no-knock raids’, finding strong support among voters in each of our cities.
For example, 63% of voters in Baltimore, Maryland strongly or somewhat support ending no-knock raids. Only about 31% of voters oppose ending no-knock raids there. In Birmingham, Alabama, 49% support ending no-knock raids and 39% oppose making this change. In each of the cities in our study, voters on net supported ending no-knock raids to a statistically discernible degree.
At the national level, voters have not changed their attitudes from earlier in the summer. Compared to about 58% who reported they supported ending no-knock raids in August, about 59% reported the same in our more recent survey. While Independent voters were evenly split, with 42% supporting and 42% opposing making this change, Democrats and Republicans overall agreed.
Our ongoing study of criminal justice reform in America’s cities included several other items, ranging from warrant compliance windows to funding new policing alternatives. We’ve included an example Crunchbox from our study of the city of Baltimore below so that you can explore on your own, and topline results from each city can be found in the subsequent link.
See the toplines from this YouGov survey
Methodology: The national survey is based on 1,033 interviews conducted by YouGov on the internet of registered voters. The sample was weighted according to gender, age, race/ethnicity, education, US Census region, and 2016 Presidential vote choice based on the American Community Study and the Current Population Survey Voting and Registration Supplement. The weights range from 0.02 to 23.82 with a mean of 1 and a standard deviation of 1.36. In each survey, the sample was weighted according to gender, age, race/ethnicity, education, and 2016 Presidential vote choice based on the American Community Study and the Current Population Survey Voting and Registration Supplement.
The Baltimore survey is based on 307 interviews conducted by YouGov on the internet of registered voters in Baltimore, Maryland. The weights range from 0.13 to 4.55 with a mean of 1 and a standard deviation of 0.68. The Birmingham survey is based on 260 interviews conducted by YouGov on the internet of registered voters in Birmingham, Alabama. The weights range from 0.09 to 6.74 with a mean of 1 and a standard deviation of 0.96. The Charlotte survey is based on 401 interviews conducted by YouGov on the internet of registered voters in Charlotte, North Carolina. The weights range from 0.08 to 8.24 with a mean of 1 and a standard deviation of 0.9. The Detroit survey is based on 316 interviews conducted by YouGov on the internet of registered voters in Detroit, Michigan. The weights range from 0.22 to 6 with a mean of 1 and a standard deviation of 1.23. The Memphis survey is based on 325 interviews conducted by YouGov on the internet of registered voters in Memphis, Tennessee. The weights range from 0.16 to 6 with a mean of 1 and a standard deviation of 1.14. The St. Louis survey is based on 340 interviews conducted by YouGov on the internet of registered voters in St. Louis, Missouri. The weights range from 0.05 to 3.26 with a mean of 1 and a standard deviation of 0.52
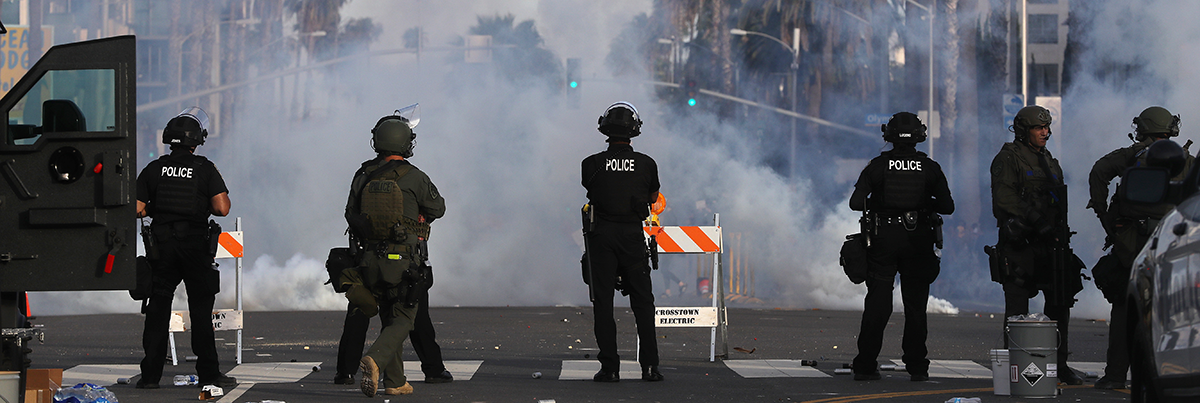
Image: Getty