
Throughout American history, 115 justices have served on the U.S. Supreme Court — 108 of them, white men. Five have been women and three have been non-white (two Black men and one Hispanic woman). In the coming weeks, nomination hearings are scheduled to begin for President Biden’s nominee, Ketanji Brown Jackson, who, if confirmed, will be the first Black woman to serve on the Supreme Court.
An Economist/YouGov Poll conducted late last month found that 55% of Americans supported Biden’s plan to nominate a Black woman, while 27% opposed it. Among the possible reasons for some Americans’ opposition to Biden’s plan to only consider Black women as nominees: not knowing, or even thinking about, the court’s representativeness historically in terms of race and gender.
In a recent survey, YouGov tested this theory, asking: Would Americans’ opinions on the Supreme Court’s representativeness and on Biden’s plan to nominate a Black woman shift if (1) they took time to reflect on the historic racial and gender makeup of the Court, and (2) if they were provided with actual statistics on the Court’s historic makeup? In our experiment, all survey respondents were asked a series of questions about the Court. What they saw before that series of questions depended on which one of three groups they were randomly assigned to:
- Group 1 (Control): Respondents started immediately with the series of questions about the Court.
- Group 2 (Guessing): Respondents were first asked to estimate the number of Supreme Court justices (out of 115) who have been men and the number who have been white.
- Group 3 (Guessing followed by data): Respondents were asked to estimate the number of Supreme Court justices (out of 115) who have been men and the number who have been white. They were then told the true gender and racial breakdown of justices, and shown the following pie charts:
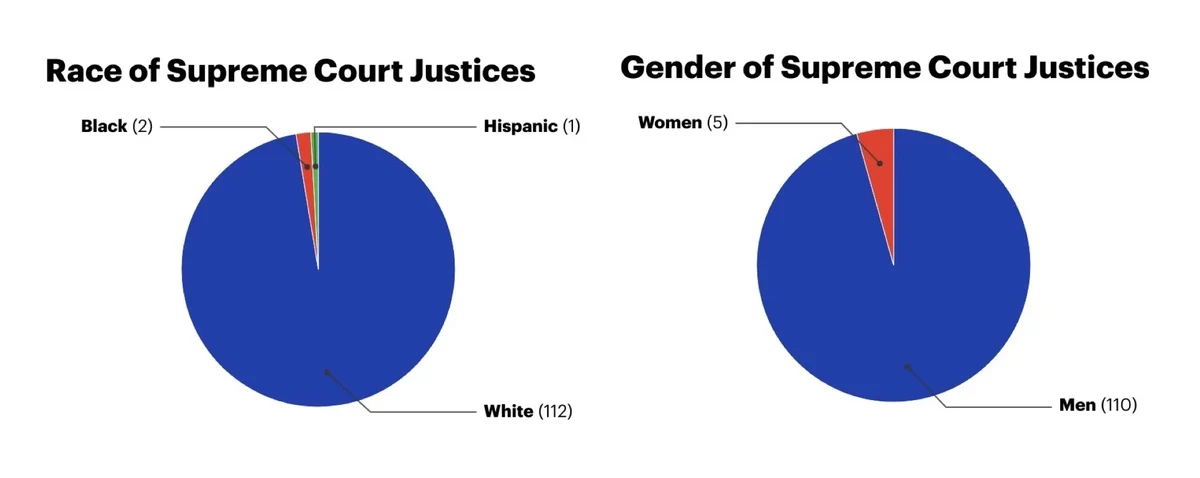
On average, survey takers guessed that 91 justices had been white (median of 96, mode of 112) and 91 had been men (median of 97, mode of 110).
After the experiment, all respondents were asked to share their opinions on the court in the standard series of questions, including how representative (in terms of race and gender) they think Supreme Court justices have been throughout history and whether they support Biden nominating a Black woman to the Court.
Americans who were explicitly told earlier in the survey how many justices have been white (112) versus non-white (3) were significantly more likely than those who were not given this information to say that in terms of race, the Court has been “not at all representative.”
Those who were explicitly told the number of justices who have been men (110) versus women (5) were significantly more likely than those in the control group to say that in terms of gender, the Court has historically been “not at all representative.”
Americans who were shown the historical racial and gender breakdown of the Court also were slightly more likely to support Biden’s decision to nominate a Black woman.
Merely being asked to guess the representativeness of the Supreme Court, without being shown the true numbers, had little effect in these three questions. We also asked respondents how important they felt racial and gender diversity are on the Supreme Court, though on these measures we found no significant differences in the responses of those assigned to different groups. The results suggest that being provided with information on historical demographics can lead to an increase in agreement on a lack of representation, though the effect was modest and inconsistent even for a case with major demographic skew. These results possibly reflect the notion that opinion on Supreme Court nominations is already fairly strong.
- Carl Bialik contributed to this article
See the toplines for this U.S. News Poll
Methodology: This U.S. News survey was conducted by YouGov using a nationally representative sample of 1,000 U.S. adult citizens interviewed online between February 25 - March 1, 2022. This sample was weighted according to gender, age, race, and education based on the 2018 American Community Survey, conducted by the U.S. Census Bureau, as well as news interest and 2020 Presidential votes (or non-votes). Respondents were selected from YouGov’s opt-in panel to be representative of all U.S. citizens. The margin of error is approximately 3% for the entire sample.
Image: Getty