
As Major League Baseball teams gear up for the start of a new season this Thursday, baseball fans across the United States are eagerly anticipating the chance to watch their favorite teams play — under a new set of rules. A YouGov poll of 1,000 U.S. adult citizens — including 347 baseball fans, or people who say they are very or somewhat interested in MLB — finds that baseball fans are more likely to support than oppose new rule changes.
Among the new rules is a measure called "defensive shift limits" that requires all four infielders to be on the infield dirt or infield grass with two infielders on each side of second base when each pitch is thrown. The rule is more supported (49%) than opposed (26%) among MLB fans, and people who are "very interested" in MLB support the rule by a wider margin (56% to 27%).
Another change will increase the size of the bases from 15 inches wide to 18 inches wide, which is designed to reduce collisions while encouraging more stolen-base attempts. The success of the larger bases during spring training has led some people to predict that the 2023 season will be the "year of the stolen base." The new rule is supported by a margin of 49% to 29% among MLB fans.
Another major new rule gives pitchers 15 seconds to throw a pitch if the bases are empty and 20 seconds if there is a runner on base. It's supported by most MLB fans (56%), with people who are "very interested" supporting it at a higher rate (61%).
No matter who they're rooting for, MLB fans are more likely to support than oppose new rules that could speed the pace of play. In 2022, the average nine-inning game took more than three hours to play. About one-third of Americans (35%) and 31% of MLB fans say this is too long for a baseball game. A majority of MLB fans (56%) say this is about the right length of time; just 38% of Americans overall agree.
MLB fans who think the 2022 average game time was too long (57%) are similarly likely as people who thought the time was about right (62%) to support the rule change, suggesting that more than concerns about game length is motivating support of the rule. (There were not enough people who thought the game time was too short to analyze.)
Most baseball fans intend to tune into games this season. Three-quarters (74%) of people who are interested in MLB plan on watching games this season on TV, and 39% have plans to attend a game; 37% plan to do both and 77% plan to watch or attend. Baseball fans are more than twice as likely as Americans overall to say they plan to watch (74% to 36%) or attend (39% to 18%) a game this season.
About two in five (42%) Americans say they have a favorite MLB team. The teams that are the favorite of the most fans nationwide are the Boston Red Sox (8%), the New York Yankees (8%), and the Chicago Cubs (7%). Among people who have a favorite team, popular reasons for their support — among a list of reasons from which they could choose as many as apply — include where they grew up (42%), their family (34%), where they live currently (28%), and the team's history (27%).
People with a favorite team were also asked if that team has a "biggest rival." Two-thirds (64%) of people with a favorite MLB team believe it has a primary rival. The most popular teams nationwide are also seen as the biggest rivals: 18% of Americans with a favorite team that has a rival team say it is the Yankees. One in nine in this group name the Cubs as their rival (11%), and 10% name the Boston Red Sox. Another 8% name the Los Angeles Dodgers.
— Carl Bialik and Taylor Orth contributed to this article
Related: The best Major League Baseball mascots, ranked by Americans
See the results from this YouGov poll conducted on March 17 - 19, 2023
Methodology: This poll was conducted online on March 17 - 19, 2023 among 1,000 U.S. adult citizens. Respondents were selected from YouGov’s opt-in panel using sample matching. A random sample (stratified by gender, age, race, education, geographic region, and voter registration) was selected from the 2019 American Community Survey. The sample was weighted according to gender, age, race, education, 2020 election turnout and presidential vote, baseline party identification, and current voter registration status. Demographic weighting targets come from the 2019 American Community Survey. Baseline party identification is the respondent’s most recent answer given prior to March 15, 2022, and is weighted to the estimated distribution at that time (33% Democratic, 28% Republican). The margin of error for the overall sample is approximately 3%.
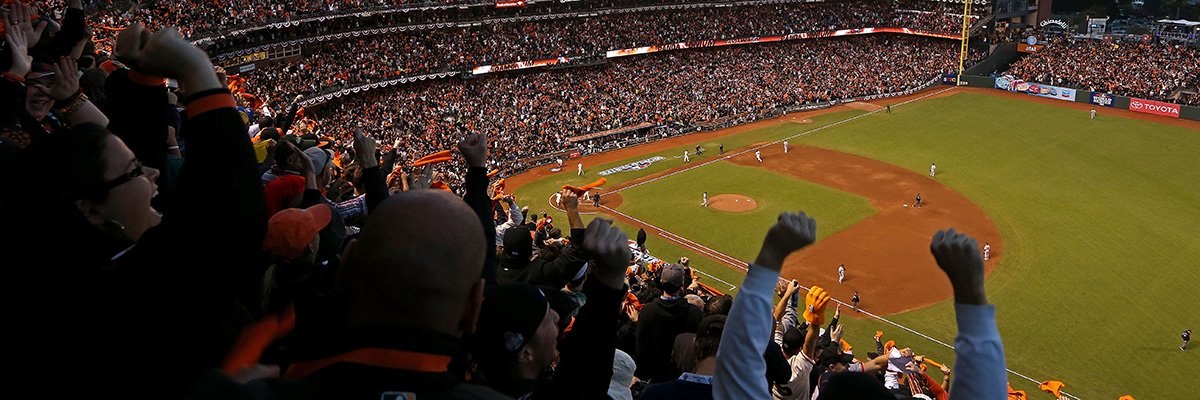
Image: Getty Images (Ezra Shaw)