

We think that weighting to past vote is important, and that the bouncing polls seen in recent weeks are deceptive
Recently Nate Silver asked us why our polls don’t bounce around much. In our polling, Clinton had a small lead in September which expanded to five or six points after the first Presidential debate on September 26. Since then a lot has happened – sex tapes, election rigging, WikiLeaks – but our numbers have budged only slightly. Over the past three weeks, our election model and polling for The Economist has shown a consistent lead for Hillary Clinton over Donald Trump of three to five percent. In contrast, some other polls have shown wide swings. For example, the ABC/Washington Post poll had a Clinton lead of two points on September 22, rising to 12 points on October 22-23, and falling back to a single point yesterday.
We believe that most of the bounces seen in surveys this year represent sampling noise that can be reduced or eliminated by adopting by better statistical methodology. We risk a repetition of 2012 where polling swings were largely statistical mirages. The convention and first debate bounces in 2012 were mostly the consequence of transitory variations in response rates. Fewer voters were changing their minds than were changing their inclination to respond to surveys.
The Problem of Phantom Swings
Most telephone polls use independent samples, so the respondents in one week’s poll are different from those in another week’s. This makes it impossible to distinguish change in individual vote intentions from changes in sample composition from week to week. It is possible that five percent of the electorate switched from Clinton to Trump over the past week (decreasing Clinton’s lead by 10 points). But it’s also possible that nobody switched and apparent swings are due to differences in sample composition.
YouGov draws its samples from a large panel of respondents. In most of our polls, there is little overlap from one sample to another. However, sometimes the same respondents are recontacted to see whether their opinions have changed. For example, after the first presidential debate in September, we reinterviewed 2,132 people who had told us their vote intentions a month before. 95 percent of the September Clinton supporters said they intended to vote for her. None of them said they intended to vote for Donald Trump, but five percent said they were now undecided, would vote for a third party candidate, or would not vote. Of the Trump supporters, only 91 percent said they were still planning on voting for Trump. Five percent moved to undecided, one percent to Clinton, and the rest to third party candidates or not voting. The net effect was to increase Clinton’s lead by almost four points. That was real change, though significantly less than the ten point change to Clinton’s lead seen in some polls.
Other events, however, have not had any detectable impact on voting intentions. We did not see any shifts after the release of the Access Hollywood video, the second or third presidential debates, or the reopening of the FBI investigation into Clinton’s emails. When the same people were reinterviewed, almost all said they were supporting the same candidate they had told us they were supporting in prior interviews. The small number who did change their voting intentions shifted about evenly toward Clinton and Trump so the net real change was close to zero.
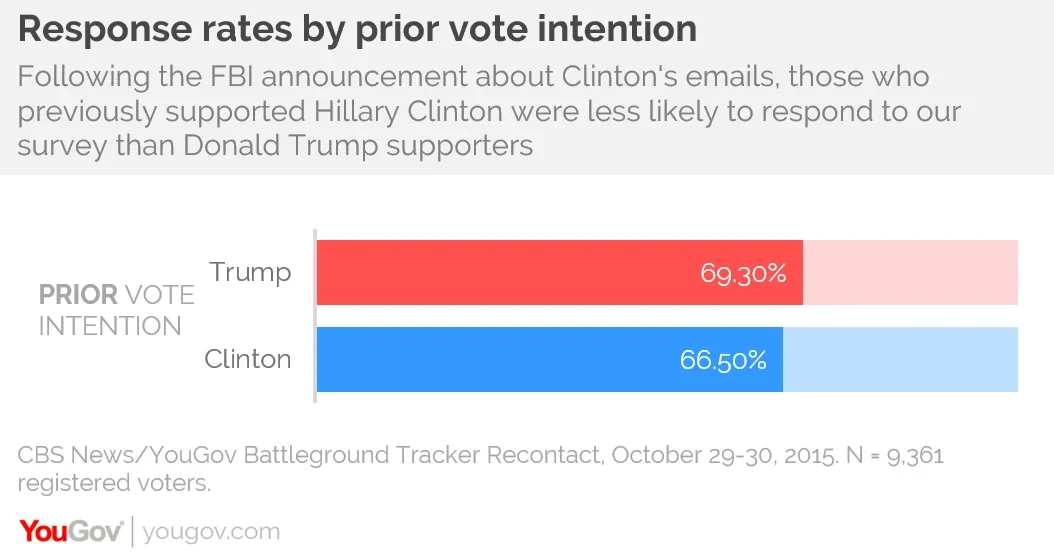
Although we didn’t find much vote switching, we did notice a different type of change: the willingness of Clinton and Trump supporters to participate in our polls varied by a significant amount depending upon what was happening at the time of the poll: when things are going badly for a candidate, their supporters tend to stop participating in polls. For example, after the release of the Access Hollywood video, Trump supporters were four percent less likely than Clinton supporters to participate in our poll. The same phenomenon occurred this weekend for Clinton supporters after the announcement of the FBI investigation: Clinton supporters responded at a three percent lower rate than Trump supporters (who could finally take a survey about a subject they liked).
Failure to control for non-response will result in “phantom swings” – polls bouncing because of changes in sample composition despite no change in individual voting intentions. Of course, most pollsters try to correct for differences in sample composition by weighting samples to reflect population demographics. However, for reasons discussed below, demographic weighting is often ineffective in removing the type of nonresponse associated with campaign events.
The Solution: Weighting on Past Vote
If every survey were a recontact survey, then phantom swings could be eliminated by weighting on past voting intention. Unfortunately, endless recontact studies would bore panellists, who would eventually stop responding at all. We have found, however, that 2012 Presidential vote works nearly as well and, once collected, doesn’t need to be updated.
The argument for weighting to past vote is the same as weighting to demographics, such as age, race, gender, or education: if your sample is unrepresentative in terms of some characteristic and the people with this characteristic vote differently than the people without the characteristic, then the sample will give biased estimates. Everyone understands that if the sample has too many men and not enough women, the sample will be biased toward Trump, since men are more likely to vote for Trump than women. For example, if 60 percent of the sample was male (compared to, say, 50 percent of registered voters, to keep the arithmetic simple) and men vote 10 percent more Republican than women, the sample will overstate Republican vote by one percent.
In the same way, if a sample has too many people who voted for Obama in 2012 and too few who voted for Romney, it’s likely to exaggerate support for Clinton. The problem is more severe than for skews in gender, because the gender gap is a lot smaller than the party gap: the difference between the proportion of men and women voting for Trump is around 10 percent, while the difference between Obama and Romney supporters is more like 80 percent. Having 10 percent too many Romney voters in your sample is a lot worse than having 10 percent too many men – the bias would be about eight times greater.
Further, we know the 2012 vote totals just as accurately as we know the distribution of gender, race and other demographics. There are some complications because some 2012 voters have died in the intervening four years and been replaced by younger voters who tend to be more Democratic, but life tables can be used to adjust the 2012 vote targets to reflect differential mortality. If the data on past vote are available, why shouldn’t they be used for weighting?
In two recent posts, the other Nate – New York Times Upshot columnist Nate Cohn – has criticized weighting to past vote. Cohn claims, without citing any evidence, that “People just don’t seem to report their past vote very accurately. Answers tend to wind up biased toward the winner.” If recall bias is substantial, then it would indeed cause problems, though you might have a similar worry about overstatement of income, education, and past turnout.
Because many of YouGov’s panellists were interviewed about their 2012 vote before and immediately after the 2012 election and the samples were within a point of the actual election outcome, recall bias is really only a problem for panellists who joined the panel after 2012. For these, we were forced to rely on a subsequent report of 2012 voting, though all were conducted before the start of this year’s general election campaign. Nonetheless, for about 60 percent of panellists, 2012 vote is recalled rather than a contemporaneous report.
We were surprised when we canvassed the academic literature on recall bias that most of it consisted of comparing the percentage recalling how they voted with the percentage of votes actually cast for that candidate. The problem with this type of analysis is that surveys are known to grossly over-estimate turnout, so that most of the bias toward the winner could come from people who didn’t actually vote. The few studies that actually compared recall of past vote with the respondent’s contemporaneous report of how they voted showed little bias.
We recently conducted an experiment to test the accuracy of recall of 2012 vote. We selected a set of 1,597 YouGov panellists who had been interviewed immediately after the 2012 election. We matched these respondents to voter files and randomly assigned them to recontact by internet or phone. The percentage giving the same answer in their 2016 interview as their 2012 interview is shown in the table below.
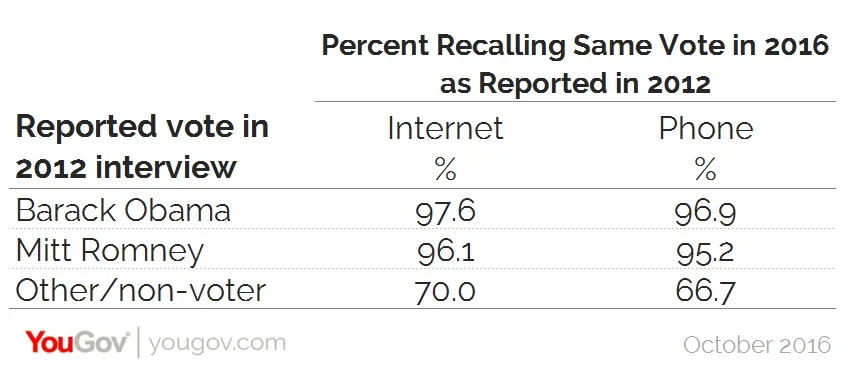
In fact, few voters gave inconsistent reports of votes in 2012 and 2016. Phone recall was only very slightly less accurate than Internet recall. If you omit the small number of third party voters (who were less than 2 percent of the 2012 electorate) and 2012 non-voters (about 12 percent of registered voters), then there isn’t a lot of room for recall bias. About 95 percent of respondents gave the same answer both times. For those who gave different answers, there is little evidence of any asymmetry in who they recalled voting for. The net bias toward Obama was about one percent (a bias that would lead to slightly overstating Trump support in a 2016 poll using past vote weighting). If only all of our benchmarks for weighting were this reliable.
The Impact of Weighting to Past Vote
We find the argument for weighting to past vote to be persuasive in principle and have shown that recall data is, contrary to what some have claimed, quite reliable. This brings us to the key question: what can go wrong if you do not use past vote weighting or some other method for balancing a sample on political variables? Here is what can go wrong. In the plot below are the fractions of 2012 Obama and Romney voters in our raw unweighted sample for two weeks surrounding the second presidential debate:
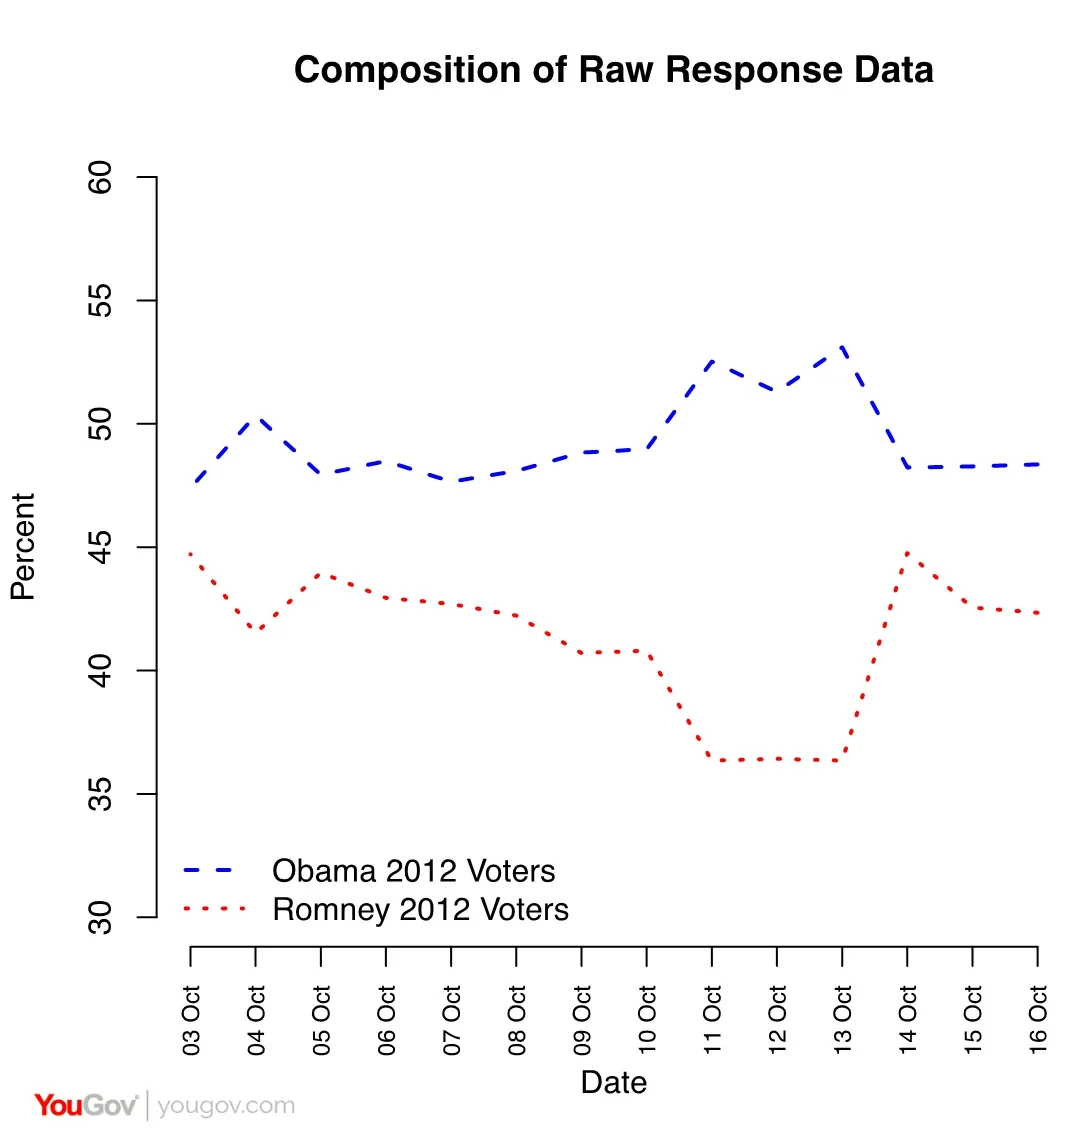
The second presidential debate occurred on the evening of October 9. Even before that, Obama voters were over-represented in our raw data. From 11 October to 13 October response rates among 2012 Romney voters sagged even further, but then bounced back. Since 2012 vote is from interviews conducted in the preceding four years, the variability in this plot is due solely to differential response rates. Failure to remove these sample skews would severely bias the estimated vote.
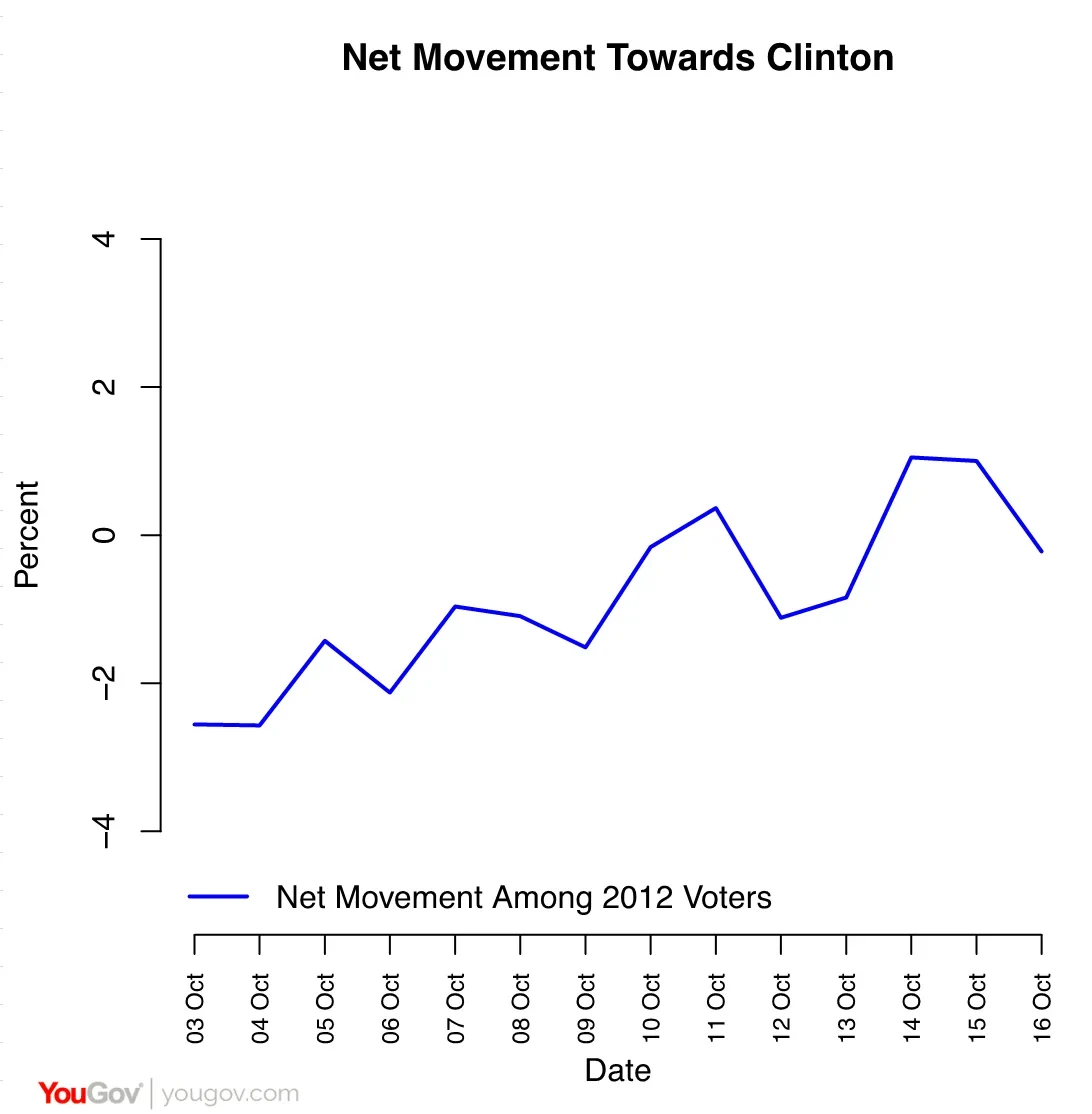
However, despite the enormous fluctuations in sample composition, the voting intentions of the 2012 Obama and Romney voters who did respond stayed relatively stable. Among those who voted in 2012 (and adjusting the sample for the distribution of surviving voters), Clinton improved steadily during this period. As a consequence, our estimates saw Clinton gradually pushing her lead from 3 to 5 points over the first two weeks of October, as opposed to the wild swings that would have resulted if we did not weight by 2012 vote.
What it means
In view of the patterns described above, we are highly skeptical of polls showing a double-digit margin for Clinton at various points in recent weeks. We think it is very likely that these polls are biased, reflecting samples that were disproportionately composed of Obama 2012 voters with inadequate sample adjustments.
Could we be wrong about this? Of course. Weighting to past vote assumes that the sample is representative of 2012 Republican voters more broadly. This could be wrong. It is possible that 2012 Romney voters who don’t like Trump could be skipping our surveys. Turnout of 2012 Romney voters could be lower than turnout of 2012 Obama voters. But one should be very wary of assuming survey response rates will mirror turnout rates, so that nonresponse won’t matter. No pollster assumes sample demographic skews aren’t a problem because the same variables are predictive of turnout.
In our analysis of the EU referendum in the United Kingdom earlier this year we were similarly careful to make sure that we were assuming the right distribution of 2015 UK general election votes for each party, and that was really critical to getting the right answer (a narrow leave victory). A Leave vote in the UK referendum, like a Trump vote, was viewed as a thumb in the eye of the political establishment. People who are alienated from the political system are less likely to respond to polls, especially when they (rightly) suspect that their preferences are the subject of scorn. While such groups are often less likely to vote as well, there is no reason to expect them to vote at lower rates in the 2016 election than they did in 2012. You might even, given how large a departure Trump is from past Republican nominees, suspect the opposite could be true.
Such turnout swings are fundamentally difficult to predict though. Based on a turnout model that assumes voting patterns are similar to 2012, we do think that Clinton’s position steadily improved following the first debate, and (as of this writing) estimate that she will win nationally by about the same margin that Obama won by in 2012. But we simply did not see the kind of movements of Romney voters, either to Clinton or to third party candidates, necessary to generate a double-digit victory for Clinton.
We consider it almost certain that Clinton was never as far ahead as many published polls suggested at the high points of the campaign, and equally that she has not lost as much by recent events as some published polls suggest. The truth is more boring: real change mostly happens slowly, and the impact of campaign events is much less than the media makes out.