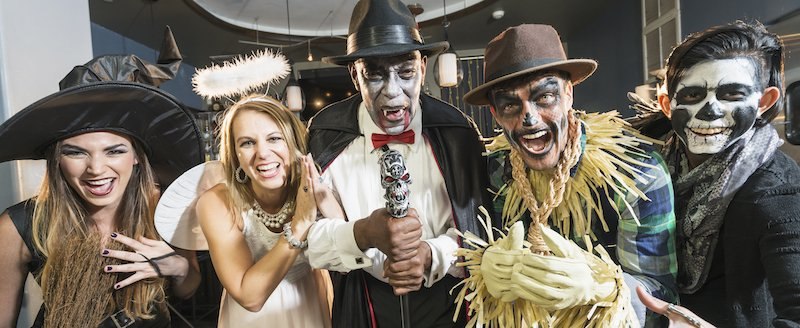
Spooky season is upon us. With Halloween nearing, a new YouGov survey asked Americans about their Halloween costumes and whether they find certain costumes — such as a costume with a realistic gun or other weapon, or a cultural costume worn by someone who is not of that culture — to be acceptable or unacceptable. Among other findings, the data shows Halloween is for the young: adults under 45 are far more likely than older Americans to say they plan to dress up for the holiday.
The poll, conducted October 11 - 14, found that 27% of Americans had plans to dress up for Halloween, including 10% who already have a costume picked out and 17% who haven’t picked their costume out yet but do plan to wear one.
Adults under 45 are far more likely than older Americans to say they plan to dress up for Halloween this year (48% vs. 11%).
12% of Americans say they’ve worn a costume for a reason other than Halloween in the last year. Among adults under 45, 20% have done so.
Among the people who already have a Halloween costume picked out for this year, 40% say their costume is entirely store-bought and 15% say their costume is completely homemade. 19% say their outfit is more store-bought than homemade and 21% say it’s more homemade than store-bought.
Among people who have picked out a costume for Halloween, 44% say they’ll be going as a fictional person or character, 19% will be an animal or creature, 16% will be dressing as a concept, and 14% will be going as a person who is alive today. Slightly fewer will be dressing as a person from history (13%), an object (11%), or something else (11%).
Among people who have already picked out their Halloween costume, 39% describe their costume as creative, nearly twice the 20% who said so in October 2022. 30% say their costume is simple, 30% say it is funny, 28% say it is unique, and 23% say it is scary. Fewer describe their costume as sexy (13%), relevant (13%), or extravagant (8%).
Among Americans who have picked out a Halloween costume, 25% are coordinating costumes with a spouse or romantic partner, marking a decrease from 2022, when 42% said they were coordinating a costume with a spouse or romantic partner. 25% are coordinating their costume with their child or children. 17% are coordinating a costume with a friend or group of friends, 16% are coordinating with other family members, and 11% are coordinating with coworkers.
Majorities of Americans say the following are acceptable Halloween costumes: a woman dressing up as a man (69%), a man dressing up as a woman (65%), a child dressing up in a cultural costume if they are not part of that culture (62%), and an adult dressing up in a cultural costume if they are not part of that culture (56%). Fewer say it is acceptable for a non-Native American person to dress as a Native American person (52%), for a person who is not transgender to dress as a transgender person (39%), for a person to wear a costume with a realistic-looking gun or other weapon (34%), or for a white person to wear black-face makeup in order to appear as a Black person (33%).
Men are more likely than women to say it’s acceptable for a person to wear a costume with a realistic-looking gun or other weapon (44% vs. 25%), for a child to dress up in a cultural costume if they are not part of that culture (69% vs. 55%), and for white people to wear black-face makeup in order to appear as a Black person (41% vs. 26%). Men and women don't differ significantly on the acceptability of women dressing as men or men dressing as women.
Black Americans are much more likely than white Americans to say it’s unacceptable for a white person to wear black-face makeup as part of a Halloween costume (70% vs. 52%). 24% of Black Americans say it's acceptable, compared to 33% of white Americans.
— Taylor Orth and Carl Bialik contributed to this article
Related:
- Do Americans actually like Halloween?
- The most popular Halloween candy in America
- Which holidays do Americans enjoy most — and least?
See the results for this YouGov poll
Methodology: This YouGov poll was conducted online on October 11 - 14, 2024 among 1,106 U.S. adult citizens. Respondents were selected from YouGov’s opt-in panel to be representative of adult U.S. citizens. The sample was weighted according to gender, age, race, education, 2020 election turnout and presidential vote, baseline party identification, and current voter registration status. Demographic weighting targets come from the 2019 American Community Survey. Baseline party identification is the respondent’s most recent answer given prior to November 1, 2022, and is weighted to the estimated distribution at that time (33% Democratic, 31% Republican). The margin of error for the overall sample is approximately 4%.
Image: Getty


