
YouGov conducted a three wave "megapoll" during the recent U.S. national elections, providing detailed estimates for the national popular vote and Presidential and Senate races in 27 states (a total of 51 contests). As in the 2008 Presidential and 2010 midterm elections, YouGov hit the national vote split with almost no error using a large national sample. In individual states, the smaller samples produced larger errors, but these estimates were, on average, more accurate than other telephone and Internet polls.
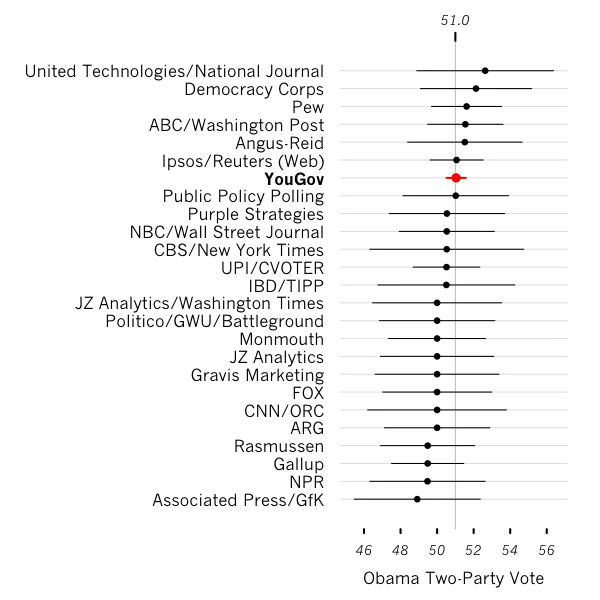
Figure 1 below shows the point estimates (and reported margins of error) for final national polls from different polling organizations for the Obama share of the national major party vote. The final YouGov poll, released on Sunday November 4, based on 36,472 interviews of likely voters between October 31 and November 3, had Obama at 48.5 percent, Romney at 46.5 percent, other candidates at 2.3 percent, and the remaining 2.7 percent of voters undecided. This translates into a 51.1 percent share of the national major party vote for Obama. As of this writing, the Associated Press reports that the Obama share of the national two party vote was 51.0 percent, so the YouGov estimate had an error of less than 0.1 percent. Two other polling organizations also pegged the Obama lead at two percent.
In Table 1, we summarize the bias (mean error) and magnitude (mean absolute error; similar results are obtained if the root mean square error is used instead) for firms that conducted Presidential polls in at least ten states in the 30 days prior to the election. YouGov had the second lowest absolute bias and the fifth lowest mean absolute error. The average sample size of the YouGov state surveys was 1,562 and the average standard error was 1.26, so this magnitude of error is what should be expected. We do not claim to repeal the laws of probability.
Table 1: Bias and Magnitude of Poll Errors
| Error in Obama Vote | |||
|---|---|---|---|
Pollster | Number of polls | Average Error | Mean Absolute Error |
SurveyUSA | 22 | 0.02 | 1.16 |
YouGov | 54 | 0.11 | 1.26 |
Angus-Reid | 11 | 0.27 | 1.10 |
Grove Insight | 17 | -0.33 | 0.92 |
NBC/WSJ/Marist | 13 | 0.33 | 1.27 |
We Ask America | 11 | 0.35 | 1.42 |
JZ Analytics | 10 | -0.42 | 1.64 |
Public Policy Polling | 60 | 0.49 | 1.42 |
Quinnipiac | 10 | 0.68 | 1.54 |
Public Opinion Research | 13 | 1.25 | 1.25 |
Gravis Marketing | 21 | 1.41 | 1.41 |
Rasmussen | 49 | 1.61 | 2.03 |
Pharos Research Group | 11 | -1.67 | 2.23 |
ARG | 13 | 2.52 | 2.52 |
In 2012, in contrast to 2010, most national poll estimates were within the reported margin of error. However, the YouGov estimate, due to its large sample size, had a much narrower margin of error (only 0.5 percent). Further, the YouGov estimate was relatively consistent between September, October and November waves. In particular, it did not produce the large fluctuations seen in some of the other national polls.
Figure 2 is a scatterplot of state level estimates (with 95 percent confidence bands) for the Obama share of major party vote in 27 states (on the left) and Senate races (on the right). YouGov correctly predicted the outcome in 26 of the 27 states (missing only Florida, where our estimate of a 1 point Romney lead conflicted with the final outcome---an Obama margin of about one half of one percent). Because of their relatively small sample size, the state level estimates are subject to larger errors. However, the magnitude of these errors is consistent with the reported margin of error (indicated by the vertical bars in Figure 2), demonstrating the validity of inferences from YouGov's methodology. One would expect, by chance, that five percent of the estimates would lie outside the 95 percent confidence interval; in fact, only one of the twenty-seven estimates was outside the margin of error. The coverage of the confidence intervals in the Senate races is a bit lower and there appears to be a slight downward bias in the Democratic vote share estimates.


Finally, in Table 2, we have also compared the voting rates in the megapoll with preliminary results from the exit poll. (These estimates are subject to change with later releases of the exit poll, which attempt to eliminate biases.) The estimated gender gap in the exit poll matches almost exactly that found in the YouGov megapolls. Estimates for whites and blacks are also very similar, though the estimate of Hispanic Democratic voting is significantly below that found in the exit poll. The age-voting correlation is also slightly stronger in the megapolls than the exit poll, though the differences are not substantial.
Table 2: Comparison of YouGov and NEP Exit Polls
| YouGov | NEP | |||
|---|---|---|---|---|
Obama | Romney | Obama | Romney | |
Gender | ||||
Male | 44% | 53% | 45% | 52% |
Female | 55% | 43% | 55% | 44% |
Age | ||||
18-29 | 62% | 34% | 60% | 37% |
30-44 | 57% | 40% | 52% | 45% |
45-64 | 45% | 53% | 47% | 51% |
65+ | 38% | 61% | 44% | 56% |
Race | ||||
White | 41% | 56% | 39% | 59% |
Black | 92% | 7% | 93% | 6% |
Hispanic | 61% | 37% | 71% | 27% |
Overall, these results provide confirmation that the sample matching methodology is highly effective in correcting self-selection biases in an opt-in panel. Not only are the estimates unbiased or nearly unbiased, the reported margins of error ensure that inferences from such samples are reliable.