
We are frequently asked how we make our election forecasts. This post provides some details of how our model works and what the results show for the 2020 U.S. presidential election. We have also updated our model estimates with data through yesterday (November 2, 2020). Be warned: some of this explanation is pretty geeky.
Like most pollsters, our national popular vote estimates were close to the outcome in 2016, but we missed on more states than we thought we would and were over-confident about Hillary Clinton winning the election. We've spent the last four years trying to improve the model and believe (hope?) that it overcomes most of the 2016 problems.
Things that are the same in our model
We rely heavily on how our panelists voted in the 2016 presidential election, mostly based upon what they told us in November 2016 immediately after the election, though we have to rely upon respondent recall for panelists who joined more recently. We have conducted extensive testing on the reliability of past vote recall. Contrary to some claims, it is pretty good and allows us to calibrate our samples to actual votes in the past election. We think this is preferable to using party ID weighting (for which reliable targets aren't available and is subject to short term movements) or a weaker predictor of vote (like party registration). That means that our polls have actual 2016 Trump voters in the correct proportions. They weren't shy then and they aren't shy now, though 3% of them say they are voting for Joe Biden today, vs 1% of Clinton voters who are backing Trump today.
We are still using very large amounts of data to make our forecasts -- to be precise, 79,834 interviews between October 23, 2020 and November 2, 2020, in our final model estimate. This is the era of big data, and pollsters should not be living with sample sizes typical of the last century.
We are also still using MRP -- multilevel regression and post-stratification. MRP is an invention of Andrew Gelman, who is known around our office as Mister P. It enables post-stratification on a large number of variables without over-fitting, allowing us to combine data across time and space in an efficient way.
One of the key ingredients in our application of MRP is a "modeled frame" of registered voters, based upon the American Community Survey (ACS) public use microdata file, the 2016 and 2018 Current Population Survey (CPS) Voting and Registration supplements, and the 2016 National Election Pool (NEP) exit poll, including demographics and 2016 presidential vote. We weighted on education in 2016 and still do it now. As have all competent pollsters for a long time.
Things that we did differently in 2020
There are a lot of things that we have done differently this year, in response to problems we detected in 2016.
We have used voter files to correct registration estimates from the CPS survey for age and gender biases. We have also corrected estimates of age, gender, race, and education among 2016 voters in NEP. This involves multiple steps of imputation to deal with inconsistent geographies, for which voter files -- administrative records of registered voters -- and precinct-level election returns have proven very useful.
In 2016, we missed some urban-rural differences that were important to the election. Our 2016 MRP estimates used state level models. This year, we switched to smaller regions known as Census Public Use Microdata Areas (PUMAs, roughly 100,000 population), so the post-stratification is for groups of voters within PUMAs, not states.
In 2020, we estimated six regional models, instead of one national model with state effects. This allows more parameter variation and speeds up the computations (since the regional models are parallelized).
The other key ingredient of MRP is a multi-level model. In 2020, we used a four level-model: voters nested within PUMAs which are (approximately) nested within exit poll geostrata which are nested within states. This increases the total number of parameters estimated by orders of magnitude. We estimate the models using Stan (another Gelman project) which enables shrinkage via hierarchical Bayesian modeling.
In past years we used a multinomial logit model for vote choice. This year, we switched to a sequential logit model: binary logistic regression for turnout, binary logistic regression for third-party vote conditional upon voting, and finally a binary logistic regression for Trump-Biden choice for major party voters. We used different covariates in each model, which picks up regional differences that get disguised in national models.
We were able to speed up computations by a factor of ten, using some (we think) clever optimizations involving compressed matrix storage for large design matrices. Thanks again to the Stan team for adding this feature!
What we found
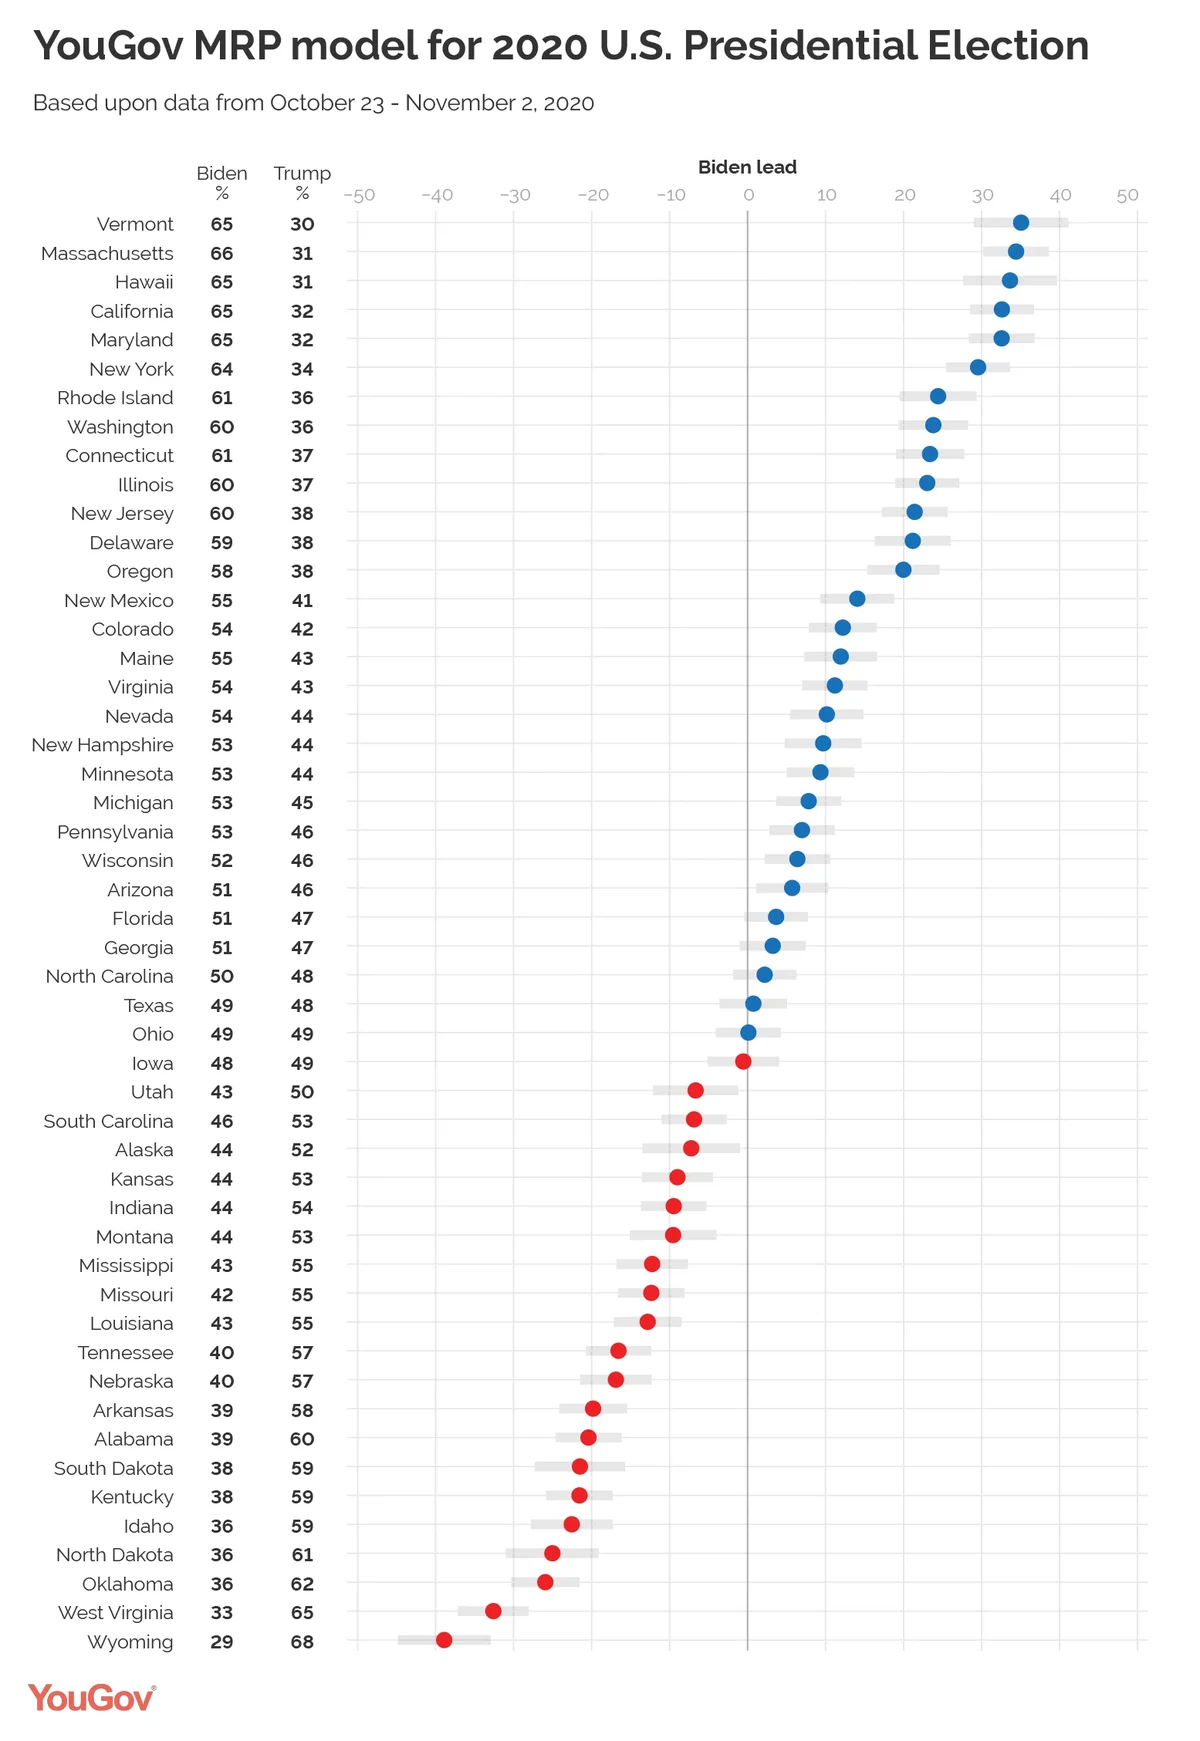
We estimate that Biden will win the national popular vote by 9% with a margin of error of +/- 3.2%. Our state level estimates are shown in the table below. Biden is leading in 28 states with 350 electoral votes and Trump is leading in 20 states with 126 electoral votes. In the remaining 3 states (with 62 electoral votes), Biden and Trump are within 2% of each other. Our best estimate for the electoral college is that Biden will win 382 electoral votes with a 95% confidence interval ranging from 314 to 412 electoral votes.
We'll see what happens tonight. Fingers crossed.